23 April, 2025
Candlestick Patterns: Decoding Market Sentiment 🕯️📊
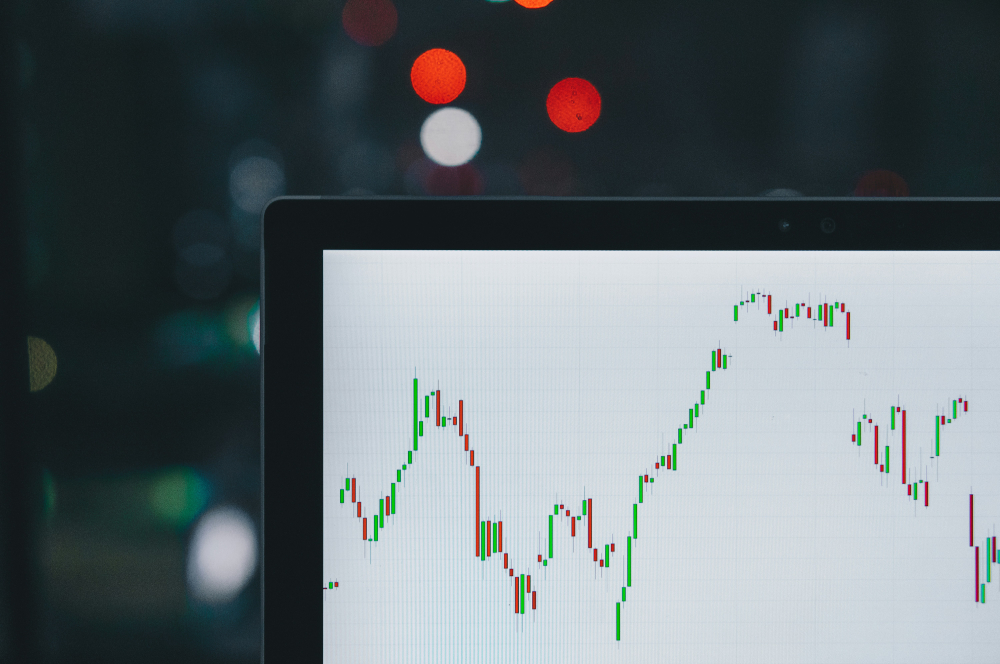
Ever wondered how traders predict market moves even before price rockets up or down? The secret often lies in candlestick patterns — a visual representation of price action that tells a story about buyers, sellers, and market psychology.
🔹 What Are Candlestick Patterns?
Candlesticks are more than just colored bars on a chart. Each candlestick shows four key pieces of information in a specific time frame:
- Open Price – where the period started
- Close Price – where the period ended
- High Price – the peak of that period
- Low Price – the lowest point
Patterns formed by one or more candlesticks indicate market sentiment and possible trend reversals or continuations.
🔹 Key Patterns to Know
1. Doji ⚖️
A Doji forms when the open and close prices are almost equal. It represents indecision in the market — buyers and sellers are evenly matched. Watch for reversals after a strong trend.
2. Hammer & Hanging Man 🔨
Hammer: Bullish reversal after a downtrend. Long lower wick, small body at the top.
Hanging Man: Bearish reversal after an uptrend. Looks identical to the hammer but appears at the top.
3. Engulfing Patterns 🌊
Bullish Engulfing: A small red candle followed by a larger green candle — indicates buyers are taking control.
Bearish Engulfing: A small green candle followed by a larger red candle — sellers overpowering buyers.
4. Morning Star & Evening Star 🌅🌆
Morning Star: Bullish reversal, often after a downtrend.
Evening Star: Bearish reversal, often after an uptrend.
🔹 Why Candlestick Patterns Matter
Candlestick patterns are like the market's mood diary. Understanding them helps traders:
- Spot trend reversals early
- Identify entry and exit points
- Gauge momentum and strength of buyers vs. sellers
📌 Tip: Combine candlestick patterns with other tools like support/resistance, trendlines, or indicators for more reliable setups.
💡 Candlestick patterns aren't just pretty visuals — they're the language of market sentiment. Learn to read them, and you're reading the market itself!
Recent Posts
17 October, 2025
Candlestick Patterns: Decoding Market Sentiment

22 January, 2025
Navigating the Crypto Market
23 April, 2025
Mastering the Stock Market: Equity Trading Strategies

Start Your Trading Journey
Today
Learn, Trade, And Grow With Our Trading Floor & Signal Rooms.
Join Us Now